Trading the financial markets? Have you mastered the trading indicators used most commonly by traders? If you still haven’t, all we have to say is – #YMYL (your money, your life). Don’t dive into the deep end of the markets without first learning more about the tools you can use for informed trading decisions. One such tool is technical analysis or using historical price data for your chosen asset to predict future price patterns. It gives you insights into the supply and demand trends, as well as market sentiment for the asset.
Now, there are many metrics that you could use to gain such insights, such as the strength of an ongoing trend or trading volumes. These help metrics offer clues regarding the future direction of the price movement, which can then help you identify entry and exit points. Fortunately, you don’t need to do extensive manual calculations to analyse the markets. Trading indicators do it all for you, plotting charts and providing easy-to-understand visual data.
Types of Trading Indicators
There are basically two types of technical indicators on which all the various technical analysis tools are based.
- Overlay Indicator: This uses an asset’s price history to plot charts, overlaying one trend on another. The two overlays are displayed as lines of different colours, for easy visibility and understanding.
- Oscillator Indicator: This indicator measures the distance between the high and low on a price chart to estimate momentum.
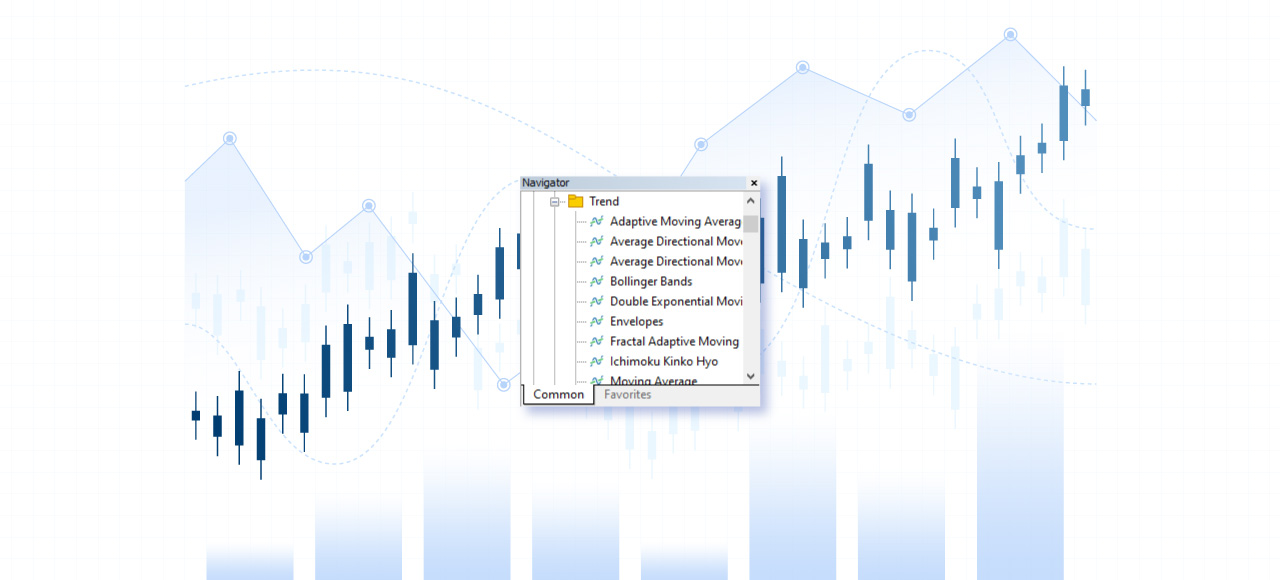
Here’s a look at the most popular trading indicators, based on the above two types.
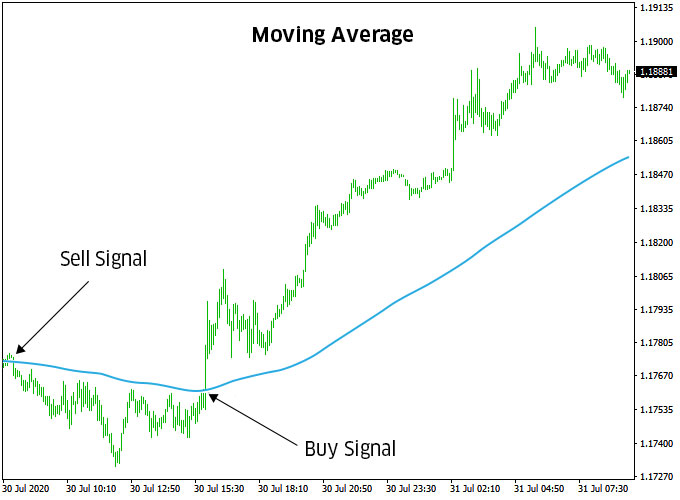
1. Moving Average (MA)
Also known as Simple Moving Average (SMA), this is among the most commonly used indicators and identifies the direction of an ongoing price trend. MA looks at the price points of an asset across a specific timeframe and divides them by the number of data points to create a trend time. Traders use the 50-day and 200-day MA most often for trading decisions. When the shorter-term MA line crosses above the longer-term line, it indicates an uptrend, while the shorter-term line crossing below the longer-term MA signals a downtrend. Moving Average can also be used to determine support and resistance levels.
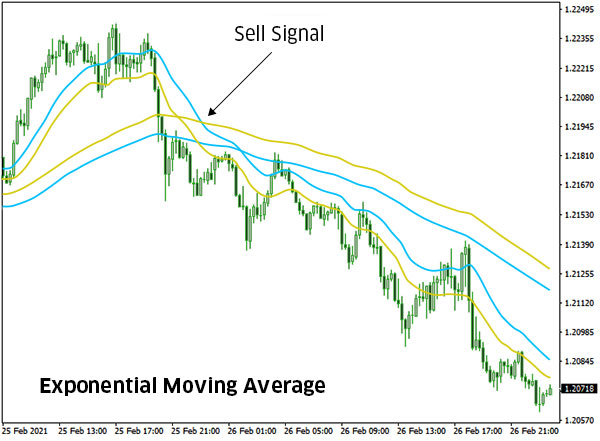
2. Exponential Moving Average (EMA)
EMA is a type of MA that gives greater weight to recent price data, making the trend line more responsive to new information. The most commonly used short-term EMAs are the 12-day and 26-day line, while the 50-day and 200-day lines are popular long-term trend indicators. EMA is usually used along with other trading indicators to confirm signals.
3. Moving Average Convergence Divergence (MACD)
MACD helps traders determine trend direction and momentum. It consists of two lines – an MACD line and a signal line. Then the MACD line cross below the signal line, it is considered an indication of a downtrend, while the MACD crossing above the signal line indicates an uptrend. When the MACD line goes below zero, it signals that the price has entered a bearish phase, which traders take as an indication to enter a short trade. When the line is above zero, it indicates bullish momentum, which signals a long position.

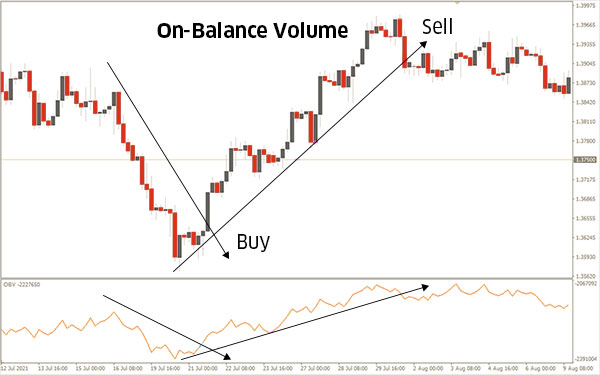
4. On-Balance Volume (OBV)
OBV measures trading volumes on an asset over time, giving a total of the up volume minus the down volume for the trading day. Up volume means the trading volume when the asset price is rising, while down volume is the trading volume during a price decline. When the OBV rises, it indicates that buyers are in-charge of the market, which is likely to push the price higher. On the other hand, when OBV declines, it means that sellers have taken charge, which could drive the price down. And when OBV is declining but price is rising, it signals that there might not be enough buyers in the market and the trend could reverse. Therefore, OBV is often used to confirm trend direction.
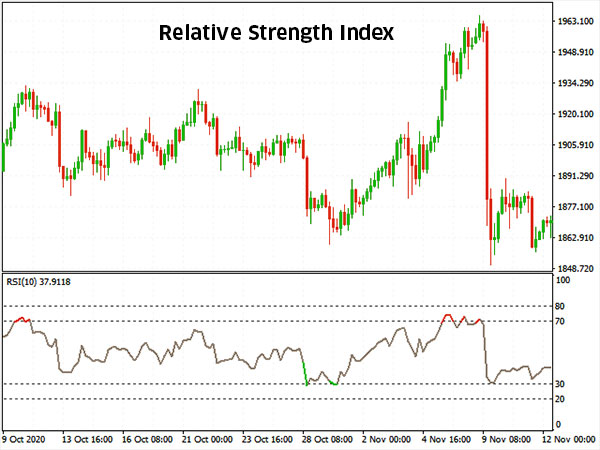
5. Relative Strength Index (RSI)
RSI helps identify trend momentum and strength on a scale of 0 to 100. When the RSI crosses 70, it is considered a signal of overbought market conditions, while an RSI of below 30 indicates an oversold market. Overbought conditions mean that the asset’s price could decline, signalling a good time to go short. When an asset enters oversold territory, it means that the price might begin to rise, indicating entry for a long position. Traders usually wait for the RSI to cross 70 and then drop below it before going short, while waiting for the price to drop below 30 and rise again before buying. RSI can also help identify support and resistance levels.
6. Stochastic Oscillator
This is another trading indicator that uses a scale of 0-100 to measure trend strength and momentum. The stochastic oscillator compares the current price of an asset to its price range over a number of timeframes. Similar to the RSI, a reading above 80 indicates overbought conditions, while a reading below 20 signals an oversold market. During an uptrend, if the indicator moves below 20 and then rises, it is considered to be a potential buy signal. The indicator is likely to rise above 80 several times during an uptrend. But during a downtrend, if the indicator rises above 80 and then drops, it is an indication of a potential short position.

7. Bollinger Bands
This indicator consists of three bands, where the middle band is the SMA line and the upper and lower bands are drawn at a number of standard deviations above and below the SMA. Bollinger Bands signal price volatility. When the distance between the upper and lower bands increases, it indicates rising volatility, while a narrowing of the bands signals decreasing volatility. Bollinger Bands can also be used to check for overbought and oversold market conditions. For instance, if the price stays outside the upper band, it could signal an overbought market, while the price moving continually below the lower band is taken as an indication of oversold conditions.

The Bottom Line
These are only a few of the numerous trading indicators you can choose from. Make sure you practice them on a demo account to see which ones work best for your trading strategy and style. While two or more indicators are used to confirm signals, remember that too many indicators could confuse you by giving conflicting signals. This also highlights the need to familiarise yourself with the indicators before using them in the live markets. After all, you do want to make the most of the markets – it is all about #YMYL.
Leave A Comment
You must be logged in to post a comment.