Candlestick charts are the holy grail of online trading. They help traders grasp all the information about price movements of an asset for any given period at a glance. Traders use candlestick charts for technical analysis, studying the price history to speculate on future price direction and identify trading opportunities. If you too want to get on board the #YMYL bandwagon and learn how to start online trading, start with these charts.
Reading a Candlestick
For each time period, a green (bullish or white) candlestick represents that the price moved up while a red (bearish or black) one indicates downward price movement. The upper and lower edges of the body mark the opening and closing prices for the duration. The wicks or shadows of the candle show the highest and lowest price hit during the chosen timeframe.

Was that too much? Online trading requires processing a lot of information with speed and accuracy. With practice, traders develop an understanding of this basic unit of technical analysis.
Quick Bite:
Initially, when Homma developed the candlestick technique for trading rice, the bullish candle used to be white and the bearish candle was black.
Types of Candlesticks
Based on the size of the body and the length of the wicks, a candlestick can be of any of the following types:

Candlestick Chart Patterns
Two or more candlesticks together form various patterns to help traders identify trend reversal or continuation. The candlestick chart patterns that inform traders of an uptrend are called bullish patterns while those that inform traders of a downtrend are called bearish patterns. Here are the most popularly used patterns:
The Star Pattern
The Morning and Evening Star are two single candlestick trend reversal patterns.
Morning Star
A morning star is a red spinning top candle at the top of a downtrend. Its upper and lower edges lie below the last candlestick of the trend. It is followed by a bullish candlestick, opening higher than the closing of the last candlestick of the bearish trend.

Evening Star
This is the opposite of the Morning Star and occurs right after an uptrend. A spinning top bullish candle higher than the last bullish candle is called an Evening Star. It is confirmed by a large bearish candlestick following the spinning top.

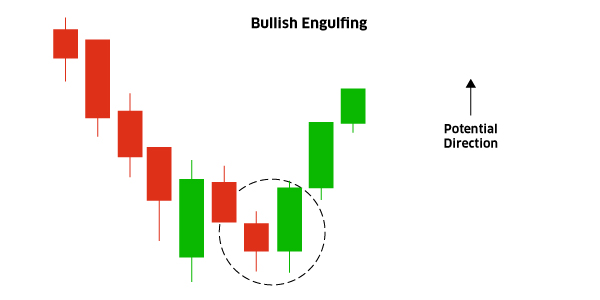
Engulfing Patterns
These are double candlestick patterns that help online traders predict a market reversal.
Bullish Engulfing
The pattern involves a large green candle completely engulfing the body of the last bearish candlestick.
Bearish Engulfing
This candlestick chart pattern indicates a reversal from an uptrend to a downtrend. The last bullish candle is followed by a large bearish candlestick. The top and bottom of the first candlestick lie within the limits of the top and bottom of the second candle.

The Pattern of the Three
Three candlesticks of the same colour represent a trend continuation. Here’s how:
The Rising Three
This pattern consists of three bearish candles sandwiched between two bullish candles. The three bearish candles form a ladder, with consecutively lower bottom edges. The bottom of the next bullish candle occurs at a gap from the prior one. The pattern confirms that bears are not strong enough to reverse the market yet.

The Falling Three
This is a continuation pattern for a downtrend. It is formed by three rising green candles between two red candles. Similar to the Rising Three, the tops of the first and the last candles have a gap.

Final Word
There are over 30 candlestick chart patterns to help traders make trading decisions. It is critical to gauge the market sentiment and stay updated with market news to predict price movements accurately. Also, traders usually confirm signals of one indicator with another before making a trading decision. If you too believe in #YMYL, learn all you can about how to start online trading before investing your hard-earned money in the financial markets.
Leave A Comment
You must be logged in to post a comment.